Essentials Page Analytics
Track page performance metrics on SharePoint pages with Microsoft Graph or real-time Matomo integration.
Configuration Guide
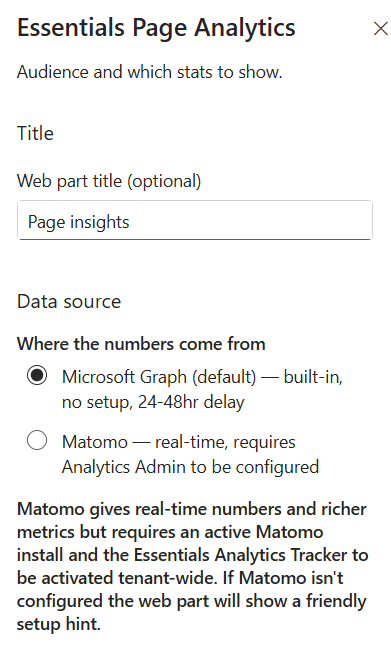
To configure the Essentials Page Analytics webpart, edit your page, select the webpart, and open the properties pane on the right.
- Web part title (optional) — Enter a custom heading to display above the analytics widget (e.g., Page insights). Leave blank to hide the header.
- Where the numbers come from — Choose the backend data source for your analytics metrics:
- Microsoft Graph (default) — Built-in provider requiring no additional setup, with a standard 24–48 hour reporting delay.
- Matomo — Real-time analytics engine providing richer metrics. Requires an active Matomo installation and the Essentials Analytics Tracker activated tenant-wide. If unconfigured, a setup hint will display.
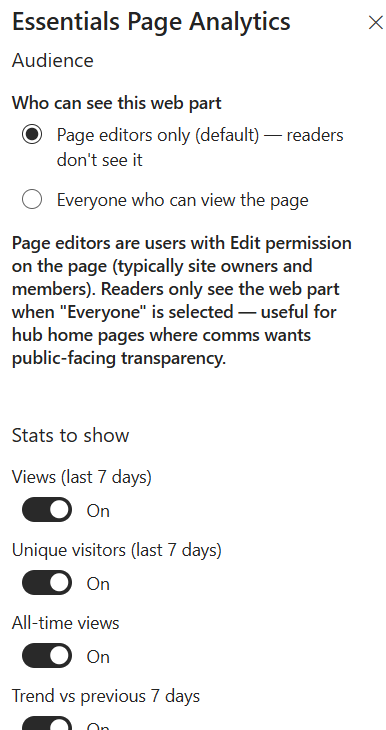
- Who can see this web part — Set visibility restrictions based on user roles:
- Page editors only (default) — Limits view rights to users with Edit permissions (e.g., site owners and members). Standard readers will not see the webpart.
- Everyone who can view the page — Displays stats publicly to all page visitors. Ideal for hub homepages where communications teams want public-facing engagement transparency.
- Views (last 7 days) — Toggle On/Off to display or hide total page views recorded over the past week.
- Unique visitors (last 7 days) — Toggle On/Off to show or hide the count of individual users who visited the page over the last 7 days.
- All-time views — Toggle On/Off to show or hide the cumulative total view count for the page since creation.
- Trend vs previous 7 days — Toggle On/Off to display a comparative percentage/trend indicator against the previous 7-day period.
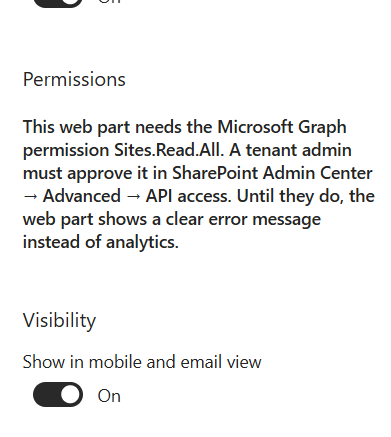
- Permissions info — Note that this webpart requires the Microsoft Graph permission Sites.Read.All. A tenant admin must approve this request in SharePoint Admin Center → Advanced → API access. Until approved, an error message will display instead of metrics.
- Show in mobile and email view — Toggle On/Off to control whether the analytics metrics render on mobile devices or within email views.
Key Features Configuration
| Feature | Description | Configuration |
|---|---|---|
| Web part title | Custom heading above the widget | Free-text field (blank hides the header) |
| Data source | Backend analytics provider | Microsoft Graph (default) or Matomo |
| Visibility | Who can view the webpart | Page editors only (default) or everyone who can view the page |
| Views (last 7 days) | Total page views over the past week | Toggle On/Off |
| Unique visitors (last 7 days) | Individual users over the past 7 days | Toggle On/Off |
| All-time views | Cumulative views since page creation | Toggle On/Off |
| Trend vs previous 7 days | Comparative percentage indicator | Toggle On/Off |
| Permissions | Microsoft Graph consent | Sites.Read.All approved in SharePoint Admin Center → Advanced → API access |
| Mobile & email view | Rendering on mobile devices and email views | Toggle On/Off |
Property Pane Options
| Option | Type | Description |
|---|---|---|
| Web part title | Text | Optional heading above the analytics widget |
| Data source | Radio | Microsoft Graph (default) or Matomo |
| Visibility | Radio | Page editors only (default) or everyone who can view the page |
| Views (last 7 days) | Toggle | Show or hide total page views over the past week |
| Unique visitors (last 7 days) | Toggle | Show or hide individual user count over the last 7 days |
| All-time views | Toggle | Show or hide cumulative view count since creation |
| Trend vs previous 7 days | Toggle | Display comparative percentage/trend indicator |
| Show in mobile and email view | Toggle | Render analytics on mobile devices and email views |
Illustration